

PROTECT YOUR DNA WITH QUANTUM TECHNOLOGY
Orgo-Life the new way to the future Advertising by Adpathway
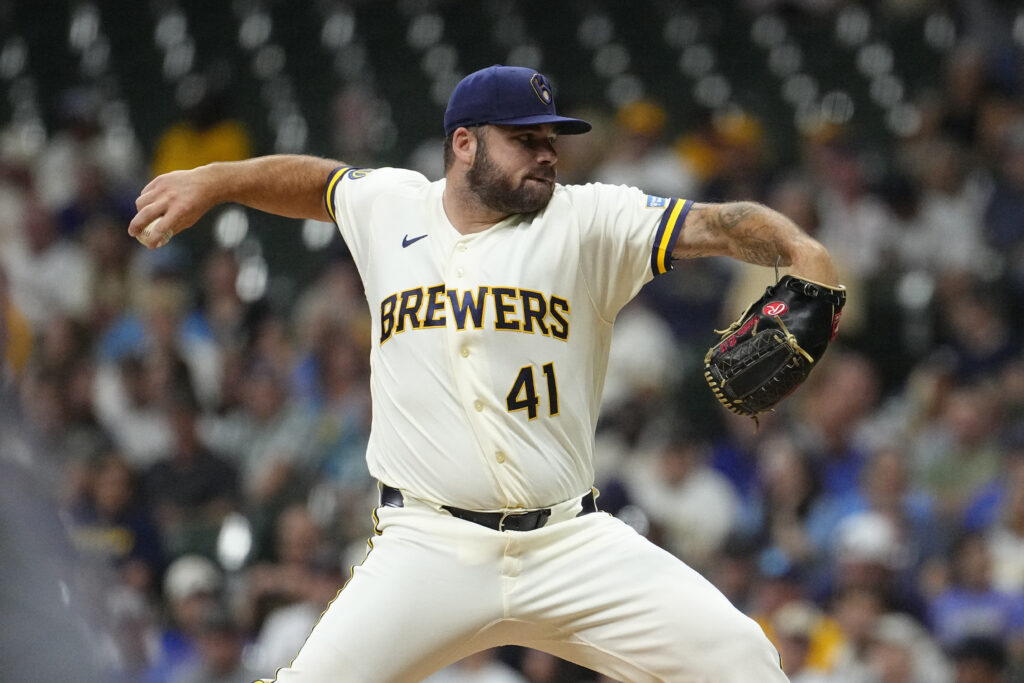
Image credit: IMAGN IMAGES via Reuters Connect
A team’s closer hits the IL with the dreaded forearm strain. Is he done for the year?
Your favorite club’s big hitter lands on the IL with a strained hamstring over Labor Day weekend. Will he be back for the playoffs?
One of your fantasy team’s catchers suffers a broken finger. Should you just let it ride with his roster spot, or will he be out long enough to justify taking a dip in the shallow catching talent pool, hoping for someone who might contribute a few homers and RBI without polluting your team batting average too much?
Or, if we may, a real-life case: Rob is responsible for the depth chart for the Diamondbacks. Last week, Arizona put Drey Jameson on the 15-day list, retroactive to July 20, with right hip inflammation. For how many days will the club be without the services of the reliever, who’d compiled a 4.67 ERA (4.14 FIP, 120 DRA-) in 11 relief appearances?
We developed a new tool, the Injured List Triage visualization, to answer questions like these. It breaks down every injury by body part and type of injury. The display below shows data for all injured list stints from 2021 to 2025. We’re looking only at IL stays beginning since the start of the season and ending before its conclusion. That way, we don’t include players who, e.g., sprain their ankle in spring training and are back in early April, or strain an oblique in September and are out for the season. Injuries like those would inaccurately shorten the average IL stint.
(You could argue by excluding players still on the IL when the season ends we could be underestimating injury severity. For example, by excluding Mike Trout’s 139 days on the IL with a season-ending calf strain in 2021, we’re undercounting the severity of calf strains for hitters. That may be true for the mean, which would go from 32.2 to 35.4 for hitter calf strains, but the median is really more salient here, and it would remain at move only from 25.5 to 27.0.)
Here’s the Triage. Explanation below.
You can input your parameters at the top. The most important inputs are on the right: Injury Description (Location) and Type of Injury. The latter is taken from the description on the MLB transaction, e.g., the June 10 entry, “Chicago White Sox placed LHP Tyler Gilbert on the 15-day injured list. Left shoulder impingement.” For that injury, you’d type shoulder into the box. That will activate the Type of Injury pulldown, in which you can enter whatever field or fields you want. Click Inflammation to capture Gilbert’s impingement.
As you’ll see, there have been 168 players put on the IL with shoulder inflammation. They missed an average of 41.5 days, a median of 34.0. The 25th and 75th percentiles are 19.0 and 52.8 days.
But that’s all players. Gilbert’s a pitcher, so we’ll click on pitcher in the Player Type field. The number of pitchers out with shoulder inflammation is 147. The average moves up to 43.0 days missed, the median to 36.0, and the 25th and 75th percentiles to 19.5 and 55.0 days, respectively. Unsurprisingly, shoulder inflammation is worse for a pitcher than a hitter (average 31 days, median 20). Gilbert was put on the IL over a month ago and has yet to return.
The Percentages of Days Missed table below that shows the distribution of injury lengths. Starting from the left, 3% of pitchers going on the IL with shoulder inflammation were out at least one week but less than two. (Yes, the average IL stint for pitchers is 15 days. It was 10 prior to the last CBA.) A plurality, 24%, were out at least two weeks but less than three. Another 12% missed at least three weeks but less than four, 7% were out at least four weeks but less than five, 14% at least five weeks but less than six. You get the pattern.
If you don’t want the units to be weeks, you can change it in the Time Lost Bin Size. If you resize it from 7 to 10, you’ll see 25% of pitchers were out 10-19 days, 18% 20-29, 13% 30-39, etc.
Maybe you would rather look at games lost instead of days lost. Switch the Unit of Measurement from the Days Lost default to Games Lost. Returning to the 7-day timeframe, the average number of games lost drops from 43.0 to 37.4, the median from 36.0 to 31.0. Because of off-days in the schedule, injured players miss fewer games than days.
The Injury By Month and % of Injuries Season Ending are pretty self-explanatory. More pitchers hit the IL with shoulder inflammation in April and May than any other month. And the percentage of injuries that are season-ending—remember, these are not included in our calculations for average length—are higher in the later months than the earlier ones.
The takeaways here are that injuries such as Gilbert’s can be expected to result in at least a month away from action assuming he returns. And an injury falling in June, as his did, has about a three-in-ten risk of ending his season.
The Injury Detail by Length of Time Lost display shows data on each player in the Percentage Days Lost bins. Red dots are 2021, blue 2022, green 2023, yellow 2024, and purple 2025. Hover over them and you’ll see the purple dot in the 42 line is the pitcher with a shoulder inflammation who missed 6-7 weeks last year: Steven Cruz (on IL August 3, back on September 19).
So let’s return to our questions.
A pitcher with forearm tightness misses an average of 53 days and a median of 38. The sample size is small, though: just nine pitchers. Add in inflammation and soreness and the sample is 40 pitchers, missing an average of 35 and a median of 22. However, at this point in the season, there’s about a five-in-eight risk that he’s out for the year. And this doesn’t include pitchers whose forearm tightness becomes something worse.
Hamstring strains are fairly common injuries for hitters, occurring 200 times in our sample set. The median days missed is 20, the average 26, so a 2-3 week absence is a reasonable guess. (Or, if you’re the Mets, it’s more like double that.) But a substantial proportion (of a small number) of such injuries occurring in September knock the player out for the year. So keep your fingers crossed about your hitter’s availability for October.
For broken fingers, we need to go down to the Injury Detail display to capture just catchers. Unfortunately—or fortunately for catchers—there aren’t a lot of datapoints. Connor Wong missed 24 days last year and Roberto Perez was on the IL 59 days in 2021. If we expand our search to all finger injuries, we additionally get Alex Jackson’s 40 days in 2022. Whether you want to replace him depends on how pathetic the remaining catchers are in your league.
And Drey Jameson? Rob had to find a substitute for Jameson for an estimated 32 days. The team called up Gerardo Carrillo the day Jameson hit the IL. He’s pitched six innings over three games, allowing just one run and earning the win in extra innings over the Pirates Tuesday night. So it’s worked out OK so far. Whether we’ll still be saying that on August 22, when Jameson will have been on the IL a pitcher-hip-inflammation-median 32 days, remains to be seen.
The Injured List Triage visualization can be found in the “Tools” section of the toolbar at the top of the site, along with the other injury-related sites. It’ll share a page with the Recovery Dashboard; you can find it here, or bookmark it for easy access.
Thank you for reading
This is a free article. If you enjoyed it, consider subscribing to Baseball Prospectus. Subscriptions support ongoing public baseball research and analysis in an increasingly proprietary environment.



![[Highlight] Mason Miller and Freddy Fermin nab the runner to take Game 1 of the series](https://external-preview.redd.it/aWp4N3J2djM5b2loMeyeTqG_ju_9C0LuHybEAmglR20n7vZOdHFez-5vu_0m.png?width=640&crop=smart&auto=webp&s=71aedf486d1cae450c35dcd3cfbfed5be91fdd5a)










 English (US) ·
  French (CA) ·