
 1 week ago
6
1 week ago
6
PROTECT YOUR DNA WITH QUANTUM TECHNOLOGY
Orgo-Life the new way to the future Advertising by Adpathway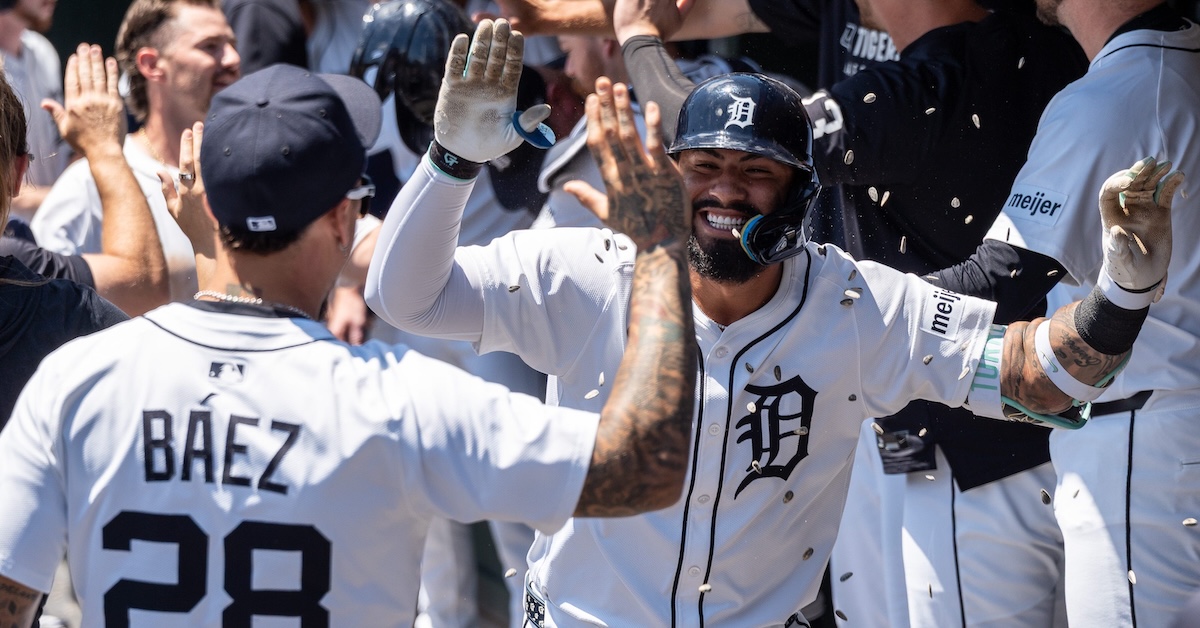 David Rodriguez Munoz/USA TODAY NETWORK via Imagn Images
We’ve now passed the mathematical halfway point of the 2025 season, which serves as a good time to check in on the ZiPS projected standings and analyze the ways in which reality has torn the preseason prognostications to shreds. While our depth charts utilize the ZiPS projections in the daily standings, this full ZiPS run utilizes the most robust methodology that I can assemble without pulling out what’s left of my increasingly dwindling supply of hair.
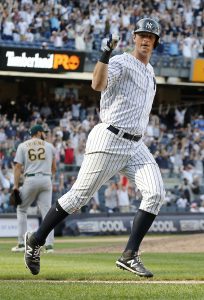
The ZiPS projected standings are the product of a million seasonal simulations. In order to get a better estimate of the upside and downside of the team, ZiPS takes an important additional step in simulating the roster itself before it ever considers a single game on the schedule. For example, in most of the New York Yankees’ simulations, Aaron Judge continues destroying pitchers on his merry way to what ZiPS projects will be an 11-WAR season, playing somewhere between 80% and 95% of the remaining games. Sometimes he regresses less from his current 13-WAR pace; other times, he drops off the pace a little bit more. Sometimes he’s dinged up a bit and misses time, and once in a while, he misses the rest of the season due to a serious injury. After an injury simulation, ZiPS fills in the depth charts in each sim based on who is available. When Judge is injured, the Yankees roster strength is typically made with more Jasson Domínguez, sometimes more Everson Pereira or Bryan De La Cruz, maybe some Spencer Jones, or as in simulation no. 111,535, a whole lot of Brennen Davis and Duke Ellis somehow. There’s a lot of PC power (I made an upgrade in May!) and a distressing amount of linear algebra involved.
Once ZiPS has a simulated distribution of a team’s roster strength, it then simulates the results of the rest of the season a million times. (Here I’ll note that a million simulations was not enough to get the Rockies into the playoffs.)
Below are the updated ZiPS projected standings through the games played on July 2. We’ll start our look with the AL East:
ZiPS Median Projected Standings – AL East (Through July 2)
| New York Yankees | 91 | 71 | — | .562 | 61.0% | 31.1% | 92.1% | 11.7% | 95.6 | 86.9 |
| Tampa Bay Rays | 87 | 75 | 4 | .537 | 19.0% | 50.5% | 69.5% | 3.2% | 90.8 | 82.3 |
| Toronto Blue Jays | 86 | 76 | 5 | .531 | 17.7% | 48.0% | 65.7% | 2.6% | 90.5 | 81.6 |
| Boston Red Sox | 81 | 81 | 10 | .500 | 1.7% | 17.7% | 19.4% | 0.7% | 84.1 | 75.6 |
| Baltimore Orioles | 77 | 85 | 14 | .475 | 0.5% | 8.3% | 8.8% | 0.5% | 81.6 | 72.9 |
The Yankees offense slowed down considerably in June, which if you believe parts of Reddit, is somehow due to too much analytics. The more likely cause is that the Yankees are extremely reliant on Judge playing like a demigod, and when he has an ordinary month — a 157 wRC+ qualifies by his standards — the lineup has trouble absorbing what were down stretches for other key parts of the offense. ZiPS still sees the Yankees as the AL East team with the fewest potential problems over the next three months, even if it doesn’t think that Max Fried and Carlos Rodón will keep up their blistering pace.
The Blue Jays’ improvements this year should serve as a reminder (though they probably won’t), that people are too wedded to recent terrible/great performances. Coming off a 74-88 season in 2024, the Jays didn’t do a whole lot to really change the nature of their team, and the biggest thing they did do — signing Anthony Santander — hasn’t worked out yet. Sometimes gravity takes care of things!
The Rays have done their usual excellent patchwork job, but ZiPS isn’t really sold on the lineup maintaining wRC+ of 109 over the rest of the season. The computer is optimistic about Boston’s pitching staff, but the divisional math is getting difficult, and this is a team that didn’t really aggressively chase the playoffs when similarly situated in the race the last few years. ZiPS still thinks the O’s are a good team, albeit one with serious rotation issues, but they’ve banked so many losses that it’s getting hard to say that their current long shot odds are enough to keep 2025 a going concern.
Turning to the AL Central:
ZiPS Median Projected Standings – AL Central (Through July 2)
| Detroit Tigers | 93 | 69 | — | .574 | 91.6% | 5.5% | 97.1% | 7.3% | 97.4 | 88.8 |
| Cleveland Guardians | 81 | 81 | 12 | .500 | 4.6% | 25.6% | 30.3% | 1.7% | 85.8 | 77.2 |
| Minnesota Twins | 80 | 82 | 13 | .494 | 3.1% | 19.8% | 22.9% | 1.1% | 84.7 | 76.0 |
| Kansas City Royals | 78 | 84 | 15 | .481 | 0.8% | 7.0% | 7.8% | 0.3% | 81.2 | 72.7 |
| Chicago White Sox | 53 | 109 | 40 | .327 | 0.0% | 0.0% | 0.0% | 0.0% | 56.9 | 48.6 |
The Tigers have pretty much ended this race, and with an excellent rotation headed by the best pitcher in baseball right now, Tarik Skubal, this is an extremely dangerous playoff team. Detroit’s projected final win total has increased more than any other team in the baseball, jumping from 81 wins to 93.
ZiPS still sees the Guardians and Twins as legitimate playoff contenders, though it doesn’t have a great deal of enthusiasm for their rosters. I don’t expect either team to be particularly aggressive at the trade deadline.
Jac Caglianone has struggled in the majors so far, and while I fully expect him to overcome his growing pains, it also means that he hasn’t done much to resuscitate an abysmal offense. Kansas City’s pitching has been excellent, but it’s simply not enough. The White Sox are projected to finish with a 12-win improvement compared to 2024! That’s… something, I guess. Somehow, the pitching has been approximately league average, and if they can actually finish the season that way, maybe pitching coach Ethan Katz deserves the Cy Young award.
Looking to the AL West:
ZiPS Median Projected Standings – AL West (Through July 2)
| Houston Astros | 94 | 68 | — | .580 | 88.1% | 9.8% | 97.9% | 12.9% | 98.8 | 89.9 |
| Seattle Mariners | 85 | 77 | 9 | .525 | 9.7% | 50.2% | 59.9% | 3.4% | 89.5 | 80.9 |
| Texas Rangers | 81 | 81 | 13 | .500 | 2.1% | 23.9% | 26.1% | 1.0% | 85.2 | 76.5 |
| Los Angeles Angels | 74 | 88 | 20 | .457 | 0.1% | 2.5% | 2.6% | 0.0% | 78.4 | 69.6 |
| Oakland A’s | 70 | 92 | 24 | .432 | 0.0% | 0.1% | 0.1% | 0.0% | 72.9 | 64.3 |
The Astros’ penchant for middling starts showed itself again this year, but as has been the case in the past, no other AL West team took the opportunity to build up a big cushion in the division. A seven-game lead at this point of the season isn’t an insurmountable one, but most teams with that kind of lead end up finishing with it. That’s especially the case when the team holding the comfortable lead is also likely the “true” best team in the division. The Astros are no juggernaut, but they can ride Hunter Brown and Framber Valdez, and the offense has been better than it had any right to be given the de facto loss of Yordan Alvarez and the de jure one of Kyle Tucker.
The Mariners have been surprising in that their offense has been a lot better than their pitching, and while ZiPS sees that flipping to a degree, they have enough holes that they still look like a .530-.540 team; that won’t be enough in most situations unless the Astros collapse. ZiPS is projecting a lot more Jacob deGrom innings these days than it was in March, but the holes in the lineup and at the back end of the rotation and bullpen leave Texas projected as merely a second-tier Wild Card contender.
Despite a near .500 record, ZiPS is still bearish on the Los Angeles Angels. Elsewhere, ZiPS thought the A’s had a pitching problem, and that’s basically what has transpired; the team’s early contention was a mirage.
Shifting to the National League, staring with the East:
ZiPS Median Projected Standings – NL East (Through July 2)
| Philadelphia Phillies | 93 | 69 | — | .574 | 65.1% | 27.5% | 92.6% | 9.8% | 96.9 | 88.4 |
| New York Mets | 90 | 72 | 3 | .556 | 34.0% | 46.8% | 80.8% | 6.3% | 94.0 | 85.5 |
| Atlanta Braves | 79 | 83 | 14 | .488 | 0.9% | 9.1% | 10.0% | 0.5% | 83.4 | 74.6 |
| Miami Marlins | 71 | 91 | 22 | .438 | 0.0% | 0.2% | 0.2% | 0.0% | 75.3 | 66.5 |
| Washington Nationals | 69 | 93 | 24 | .426 | 0.0% | 0.1% | 0.1% | 0.0% | 73.7 | 65.1 |
The Phillies have been tested by Aaron Nola’s poor start and subsequent injury, but this was always a compelling unit and they’ve carried on without serious trouble. They do need to score more runs to keep holding off the Mets, and Bryce Harper’s injury highlighted the fact that he, Kyle Schwarber, and Trea Turner have been holding up the lineup.
The Mets have cobbled together an impressive rotation seemingly from spare parts, and ZiPS is actually fairly confident they’ll be fine after a rather gloomy June. ZiPS sees the Mets as being as strong as the Phillies, but the Phillies get a projected edge by virtue of an easier schedule (ZiPS says .497 vs. .505 for the Mets) and the two-game “head start” on the second half.
ZiPS still thinks Atlanta is a very competent team, but even if you assume that there aren’t more nasty pitching injury surprises waiting and that there’s nothing fundamentally broken about Ozzie Albies or Michael Harris II, the team has a 39-46 record, and is at the point where they have to consider short-term retooling.
The computer thinks the Nationals are better than the Marlins, but are now too far behind to be a factor in the playoff race.
Moving to the NL Central:
ZiPS Median Projected Standings – NL Central (Through July 2)
| Chicago Cubs | 92 | 70 | — | .568 | 62.5% | 27.0% | 89.5% | 6.9% | 96.1 | 87.4 |
| Milwaukee Brewers | 88 | 74 | 4 | .543 | 27.1% | 43.2% | 70.3% | 4.2% | 92.5 | 83.7 |
| St. Louis Cardinals | 84 | 78 | 8 | .519 | 7.4% | 28.8% | 36.3% | 1.3% | 88.2 | 79.6 |
| Cincinnati Reds | 82 | 80 | 10 | .506 | 3.0% | 16.3% | 19.3% | 0.5% | 85.6 | 76.7 |
| Pittsburgh Pirates | 73 | 89 | 19 | .451 | 0.0% | 0.7% | 0.7% | 0.0% | 77.3 | 68.7 |
ZiPS was a massive believer in the Cubs in the preseason, being head-over-transistors in love with the team’s offense and defense, and not absolutely hating the pitching staff. That’s about how the team has played, so the projections naturally haven’t changed too much. ZiPS also saw the Brewers as the biggest danger to the Cubs, and again, it hasn’t moved off that position.
St. Louis and Cincinnati are both above .500, but the computer still sees the Cards as too broadly mediocre and the Reds as having too many positions that have been chasms for either to be a divisional threat without some things going their way. Both are plausible Wild Card teams.
The projections are actually bullish on the Pirates scoring more runs in the second half, with much of the lineup underperforming their peripheral numbers, but it’s largely in the category of “too little, too late.”
Lastly, let’s look at the NL West:
ZiPS Median Projected Standings – NL West (Through July 2)
| Los Angeles Dodgers | 99 | 63 | — | .611 | 95.9% | 3.9% | 99.7% | 19.6% | 103.7 | 95.1 |
| San Diego Padres | 86 | 76 | 13 | .531 | 3.1% | 51.4% | 54.5% | 3.2% | 90.6 | 81.5 |
| San Francisco Giants | 82 | 80 | 17 | .506 | 0.6% | 22.7% | 23.3% | 0.6% | 86.4 | 77.6 |
| Arizona Diamondbacks | 82 | 80 | 17 | .506 | 0.5% | 22.3% | 22.8% | 0.9% | 86.2 | 77.7 |
| Colorado Rockies | 49 | 113 | 50 | .302 | 0.0% | 0.0% | 0.0% | 0.0% | 53.6 | 45.1 |
ZiPS was always skeptical of the notion that the Dodgers ought to be projected for a crazy number of wins, with the preseason projections thinking that the biggest benefit to come from the team’s offseason was protecting itself from injury downside. I don’t always agree with my creation, but I did in this case. That’s sort of how things have played out; the injuries hit the pitching as hard as they usually have, but the high-end offensive talent has compensated, and team is on a 102-win pace. I’ll note that this ZiPS run was a late-night one, and does give a pretty big hit to Max Muncy’s playing time after the grisly injury he sustained in yesterday’s game. In reality, the Dodgers have a large enough lead that his exact timetable shouldn’t change the projections significantly.
The Padres have been solid and are a first-tier Wild Card candidate, but they’ve probably fallen too far behind to scare the Dodgers. It doesn’t help that they’ve gotten basically no offense out of left field and designated hitter this year. The Giants are hitting their projections after falling short the last few years, but they have a similar problem to the Padres and have gotten sub-.700 OPS performances at prime offensive positions (first base, right field, and DH).
The Diamondbacks have disappointed, in large part due to a number of serious injuries, and the team, seeing the writing on the wall, has been hinting about being short-term sellers this summer. If they aren’t, however, ZiPS still thinks that they’re good enough to end up with a Wild Card spot without anything ridiculous happening.
For their part, the Rockies can be content with the fact that they’re one of the 30 best teams in the majors.


 English (US) ·
  French (CA) ·